This is the multi-page printable view of this section. Click here to print.

Return to the regular view of this page.

Dashboard

Review workflow statistics, open analyst queues, and explore recently active tags.

The Dashboard is the starting page after login. It brings together workflow statistics, recently active tags, and your saved Assess filters. Use it to check incoming information and choose a queue to work through.
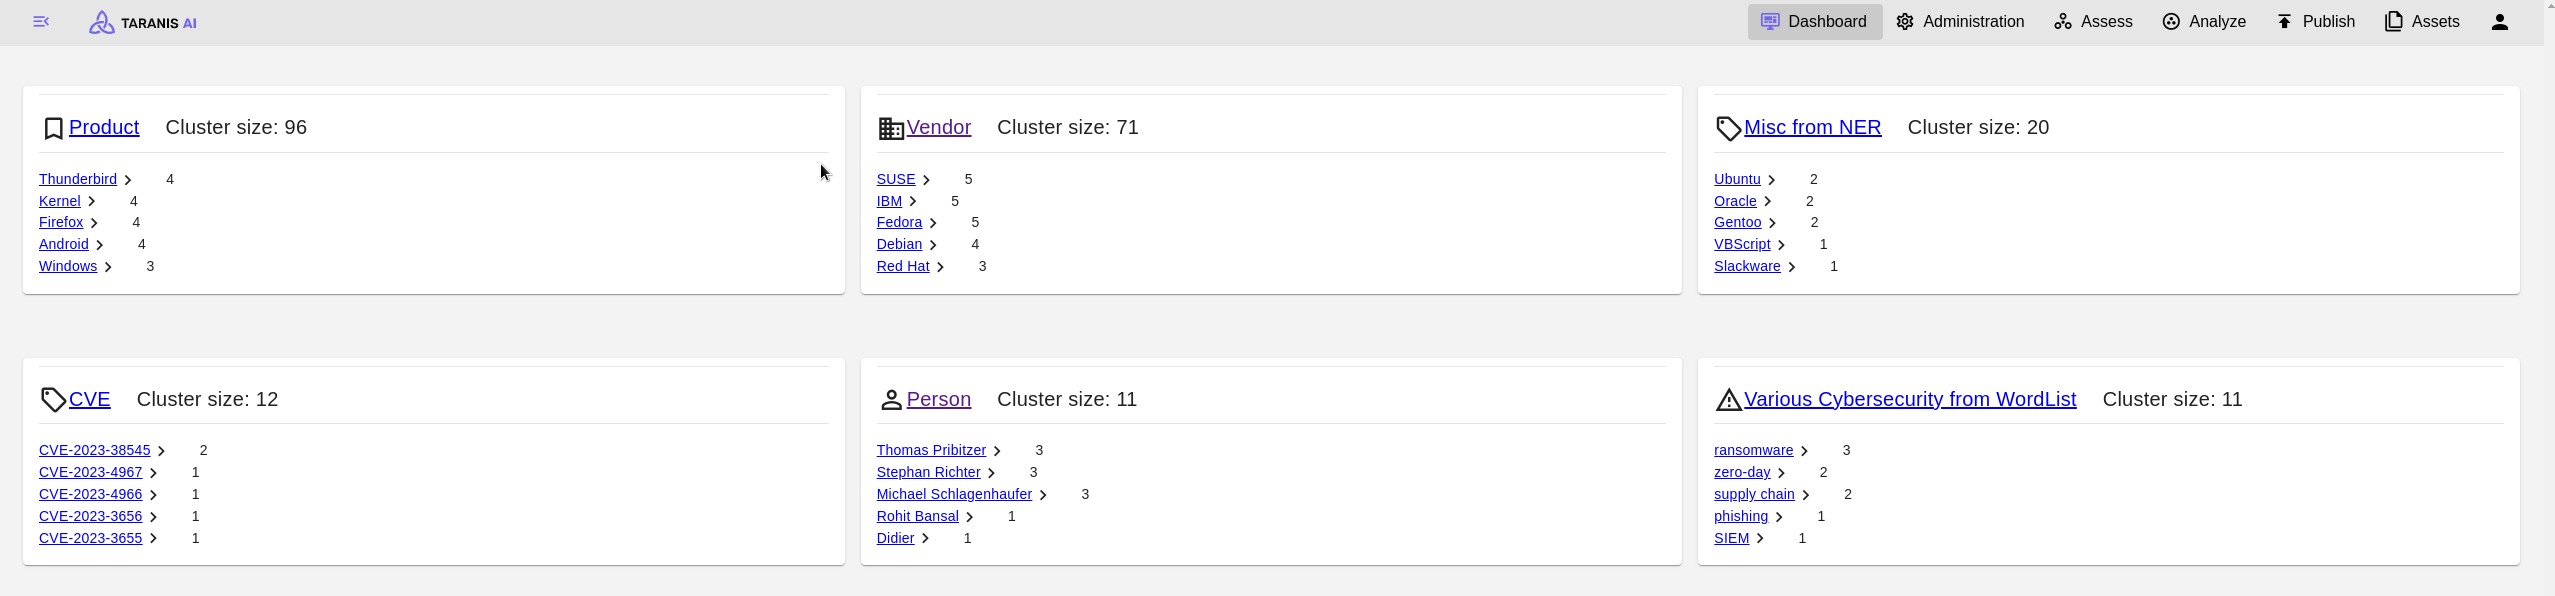
Dashboard overview

Workflow cards

Select a card’s title to open the corresponding workspace.

CardWhat it showsWhere it leads
AssessTotal News Items and Stories, plus News Items and Stories this week.Assess for reviewing collected information.
AnalyzeCompleted Reports, Reports in progress, and Reports created this week.Analyze for preparing Reports.
PublishTotal Products and Products created this week.Publish for preparing and publishing Products.
ConnectorsPending conflicts, split into Story conflicts and News Item conflicts.Conflict resolution for reviewing incoming changes.

This week runs from Monday at 00:00 UTC through the current time. News Items are counted by publication date; Stories, Reports, and Products are counted by creation date. Future dates are excluded. For example, an older article collected today may increase the News Item total without increasing this week’s News Item count.

These are instance-wide statistics. An Assess filter or a user’s content permissions can produce a different count in the destination workspace. The Publish count includes all Products; it does not indicate how many have been published or are ready to publish. Dashboard statistics are cached for 30 seconds, so recent changes may take a short time to appear when reloading.

Start analyst review

The Start analyst review button on the Assess card opens a guided workflow through Stories, a Report, and a Product.

  1. Choose an incomplete Report, or create one with a title and Report Type.
  2. Review a snapshot of the current shift’s unread Stories, newest first. Configure End of shift in User settings for shift filtering.
  3. Use Add to attach a Story to the Report, mark it read, and clear its important flag. Dismiss marks it read and clears important without adding it. Skip advances without changing the Story. The corresponding keyboard shortcuts are A, D, and S when focus is outside editable controls.
  4. After the queue, complete the Report if needed and continue to Publish. If exactly one existing Product contains the Report, that Product opens; otherwise, a new Product opens with the Report preselected. Review and publish the Product using the normal publishing controls.

The Story queue is fixed when the review starts; Stories arriving later belong to a subsequent review. The guided workflow does not publish automatically.

The button requires Assess access and update permissions, Analyze access/create/update permissions, and Publish access/create permissions. See User management if it is missing.

Recently active tags

Recently Active Tags groups tags by type, such as Country or Location. Select an individual tag to open Assess with that tag filter, or select the card’s heading to explore all tags of that type. The first three cards are visible initially; Show more reveals the rest.

The default activity window is seven days. A tag qualifies when it appears in a Story created within that window, but its displayed count includes matching Stories across all time. Each card lists up to five tags, ordered by their Story counts. Total stories sums those displayed tag counts, so a Story with several tags can contribute more than once.

See Tags and Dashboard Settings for the tag table, map, activity window, and display options.

Saved filters

Save recurring queues in Assess to make them available under Saved Filters on your Dashboard. For example, save unread important Stories, a language-specific queue, or a topic used during shift handover.

Select a saved filter’s title to open that Assess queue. Cards show the filter URL and a Default badge when applicable. The first three are visible initially; Show more reveals additional filters. This section appears once you have saved a filter.

Delete removes the saved filter from your profile after confirmation, including its Assess shortcut. It does not delete Stories. Create or update filters and choose a default through the Assess Saved filters dialog. See Filter Lists and Saved Filters.

External signals

An optional PizzINT / DOUGHCON card displays an external signal under External Signals. It is disabled by default and can be enabled per user through Edit Dashboard. See PizzINT / DOUGHCON for its fields and freshness indicators.

Conflict resolution

Open Connectors to choose Story Conflicts or News Item Conflicts. The Conflict Resolution guide explains how to compare incoming MISP changes and choose a resolution.

Administration

Users with administration privileges also have an Admin Dashboard with queue information, release details, system health, and task outcomes.
1 - Tags and Dashboard Settings

Explore tag clusters and customize your Dashboard, including the optional PizzINT signal.

Explore a tag type

Select a Recently Active Tags card heading to open its tag table. Name identifies the tag and Size shows its matching Story count. Sort by either column, use the pagination controls to browse the list, and select a row to open Assess with that tag filter.

The table lists tags across all time for the selected type. The Dashboard’s activity window only determines which tags appear on its overview cards; it is not carried into the table or the linked Assess view.

For Country and Location, the detail view also includes a geographic bubble map. Bubble size represents the matching Story count. The map uses the current table page and interprets names as countries, so arbitrary city or place names may not appear.

Edit Dashboard

Select Edit Dashboard at the top of the Dashboard. These settings belong to your user profile. Choose Update Dashboard Settings to save and return to the Dashboard.

SettingDefaultEffect
Activity Window Days7Include tags seen in Stories created within this many days. Set 0 to include all activity. Counts still cover all matching Stories.
Show Trending ClustersOnShow or hide Recently Active Tags.
Select tagsNo selectionLimit cards to selected tag types. Leave empty to include all available types. Despite the label, the choices are types such as Country or Location, rather than individual tag values.
Show Charts in DashboardOnStores a chart preference. Currently, the Country/Location map renders independently of this switch, so switching it off does not hide that map.
Show PizzINT / DOUGHCONOffLoad the PizzINT card under External Signals.

If no recently active tags appear, check that Show Trending Clusters is enabled, then widen the activity window or clear the tag-type selection. Cards need tagged Stories matching those settings.

PizzINT / DOUGHCON

The PizzINT card loads separately after the main Dashboard, so the external request does not delay the workflow cards. It displays:

  • DOUGHCON level and its readiness description.
  • Smoothed index, on a scale of 0–100.
  • Observed, the observation time in your configured timezone.
  • Stale and Fetched, when showing an older result after a refresh problem or an upstream stale response.

The About DOUGHCON information button explains the signal, lists all five levels, and attributes the data to PizzINT.watch. The card describes an indicator based on sustained, simultaneous unusual activity at multiple pizza locations.

LevelDescription shown in the card
1Maximum Readiness
2Next Step to Maximum Readiness
3Increase in Force Readiness
4Increased Intelligence Watch
5Lowest State of Readiness

Results are cached for ten minutes. If refreshing fails, a last successful result can be retained for up to one hour and displayed as Stale. When no usable result exists, the card shows PizzINT data unavailable. This is a current-status display; it does not collect Stories or maintain a signal history.

As the card’s information panel states, this signal is for informational and educational use. Correlation does not imply causation.

2 - Conflict Resolution

Compare incoming MISP changes and resolve Story and News Item conflicts.

Conflict resolution is an experimental feature for reviewing incoming MISP changes that cannot be applied automatically because the local content has also changed.

Select Connectors from the Dashboard or Admin Dashboard to open Conflict Overview, then choose Story Conflicts or News Item Conflicts. Resolving conflicts requires Assess update permission. For connector setup and sharing, see Connectors.

Story conflicts

A Story conflict occurs when the same Story has changed both locally and in MISP, preventing a clean update.

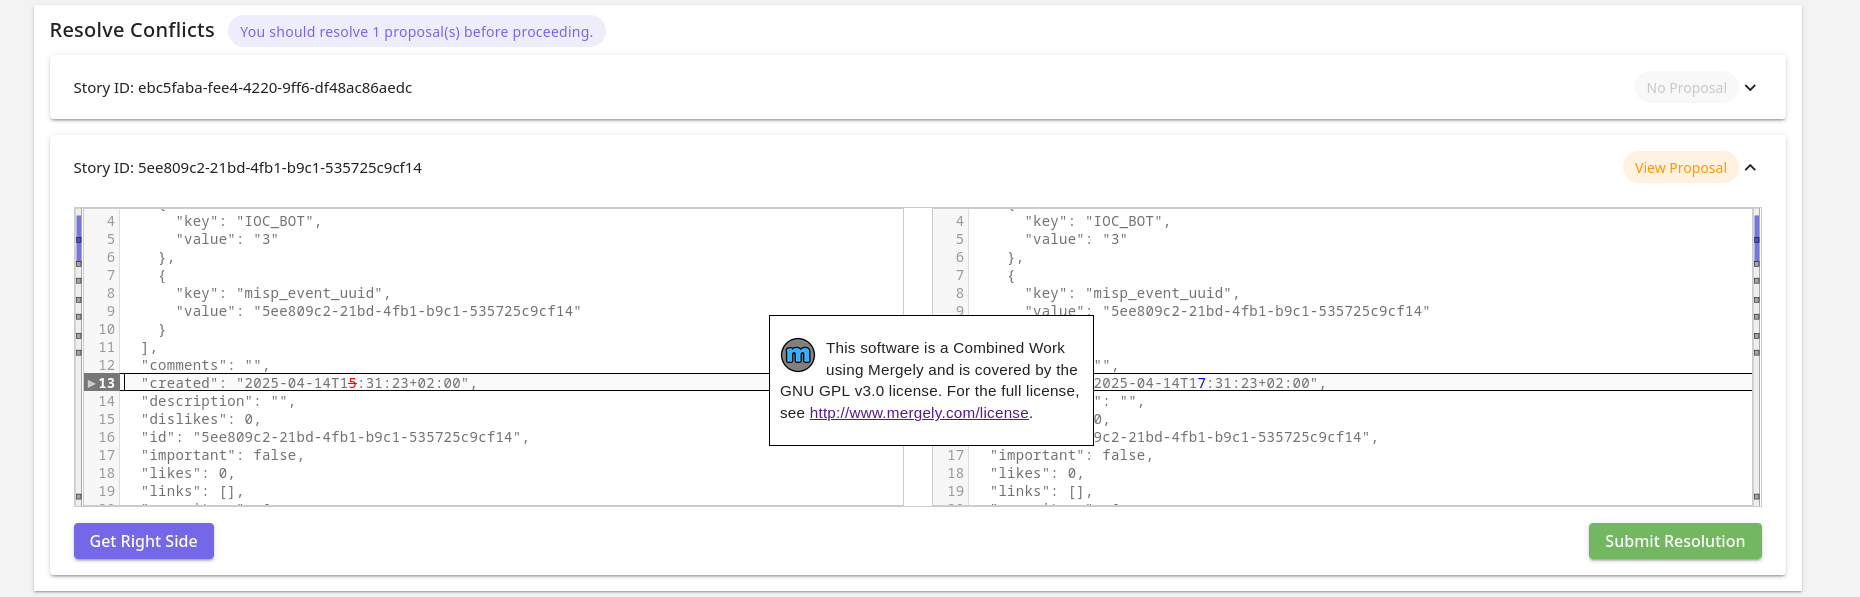
Expand a Story’s card to compare its existing and incoming content in the merge editor. Review the proposed changes, prepare the resolved content, and select Submit Resolution. The card also indicates whether MISP proposals are present.

The example below shows an incoming Story with a removed News Item and changes to comments and description.

Story conflict comparison

News Item conflicts

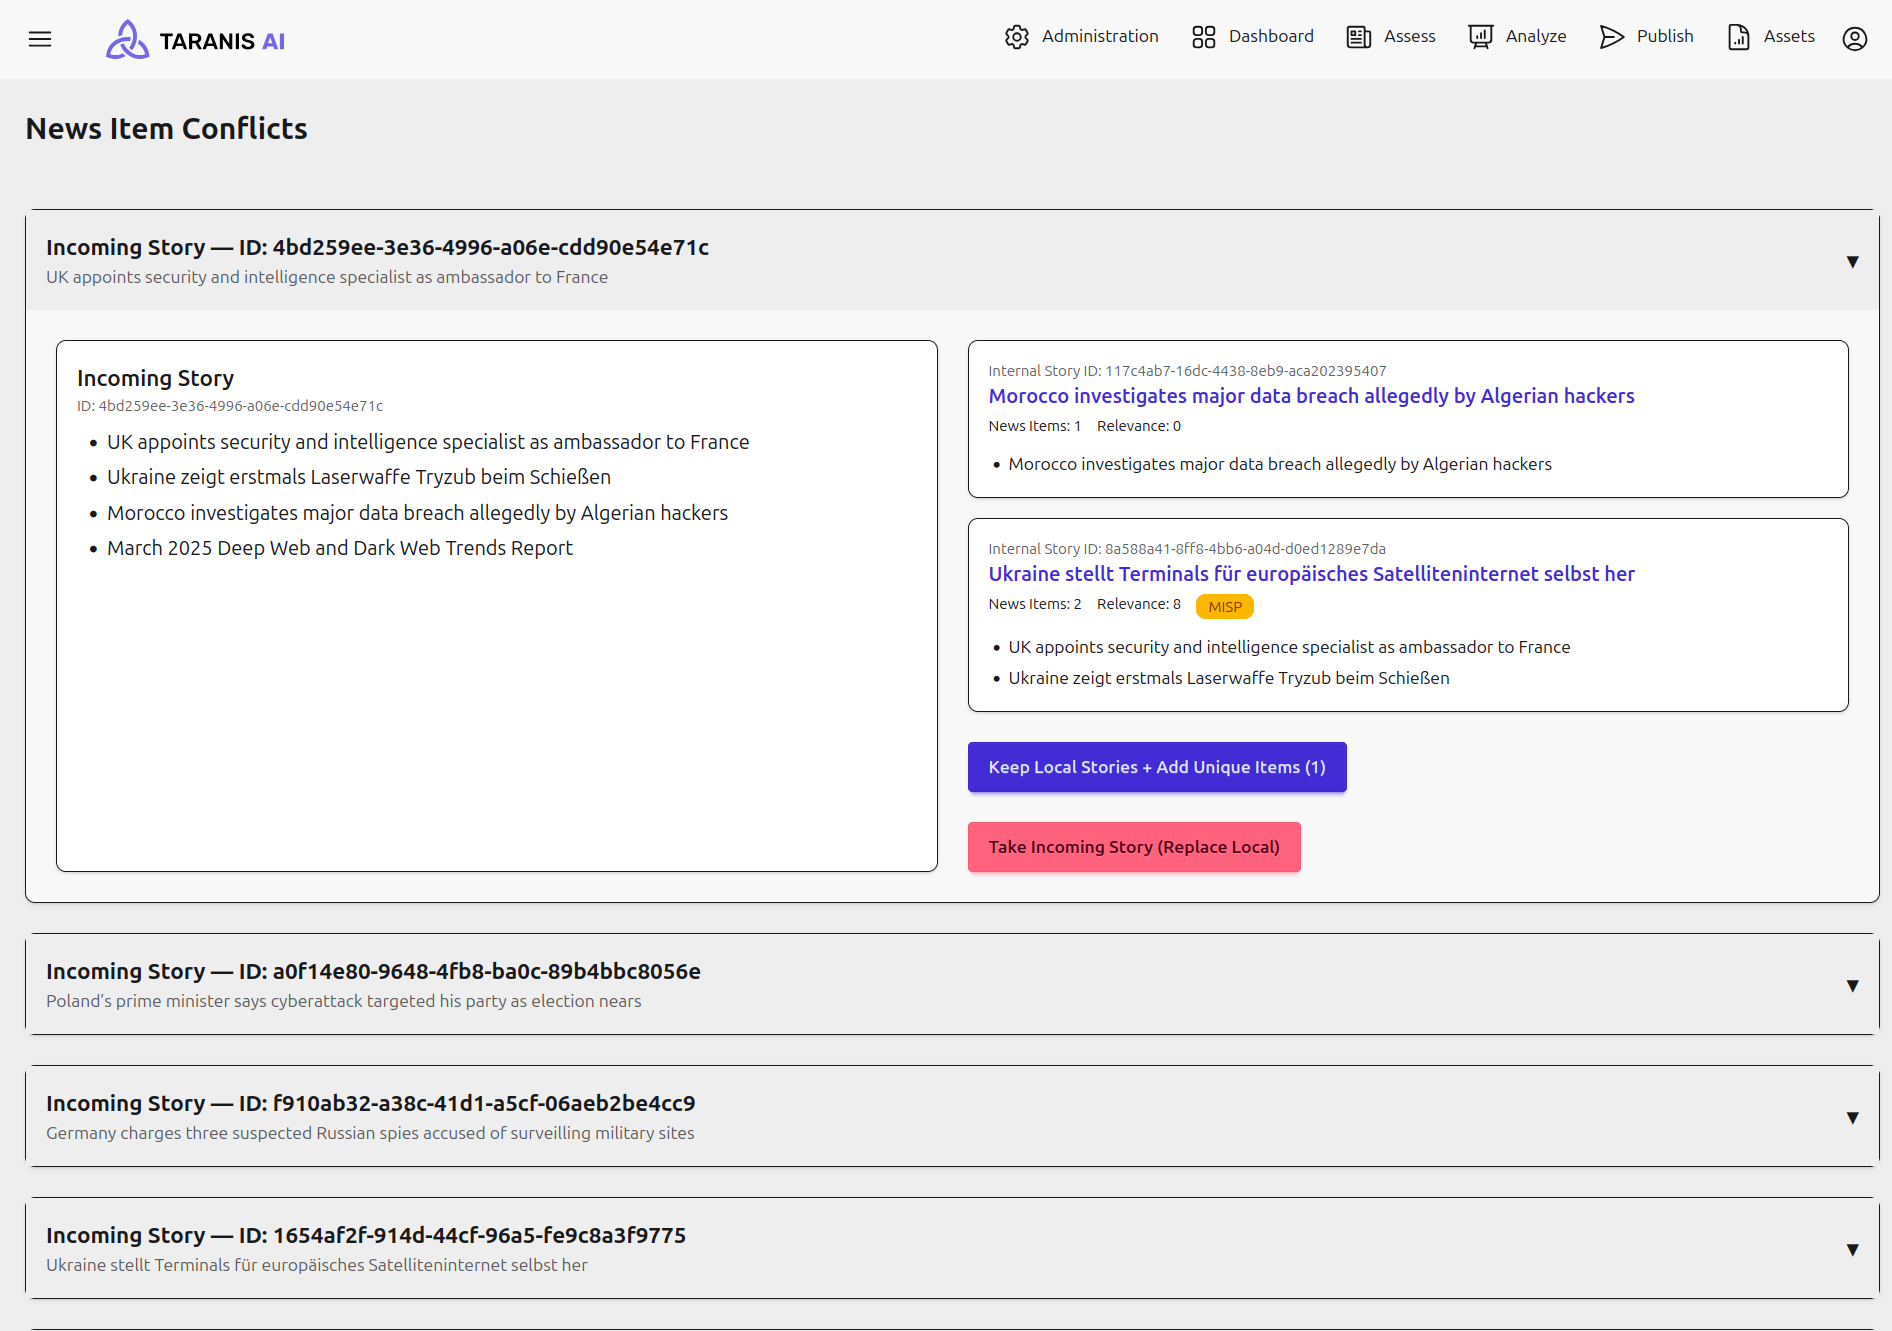
News Item conflicts occur when incoming and local Stories contain divergent News Items and local changes prevent an automatic update. Conflicts are grouped by incoming Story.

Expand a card to compare the incoming News Items with the existing local Stories. Local Story links open their details for inspection. Choose one of the following resolutions:

ActionResult
Keep Local Stories + Add Unique ItemsKeeps local Stories unchanged and ingests incoming News Items that are not already present separately. The button shows the number of unique items and is disabled if there are none or no local Stories remain.
Take Incoming Story (Replace Local)Ungroups the affected local Stories and ingests the incoming Story as supplied. Review the local grouping and content before selecting this option.

News Item conflict comparison

Conflicts are held in temporary memory. Run a fresh MISP collection before resolving them so the comparison reflects current incoming data; treat the conflict list as a working queue rather than a permanent history.

3 - Admin Dashboard

Inspect scheduled work, component versions, system health, and task outcomes.

The Admin Dashboard is available in Administration to users with the corresponding privileges. It includes the Assess, Analyze, Publish, and Connectors statistics described in the Dashboard overview, followed by operational cards.

Queue

The Queue card shows the number of scheduled tasks and the collection time of the most recent News Item. Select its heading to open the scheduler, where you can inspect:

  • Scheduled Jobs: work configured or registered to run later.
  • Active Jobs: work currently in progress.
  • Queue Failures: jobs held in the RQ failed-job registry.
  • Execution History: recorded task outcomes and statistics.

The scheduled count includes managed schedules and housekeeping jobs; it is not the number of tasks currently running. Auto-refresh: 10s is off by default. When enabled, it refreshes queue cards and the selected Scheduled Jobs, Active Jobs, or Queue Failures tab every ten seconds. Execution History does not poll.

See Background Jobs for queue services and troubleshooting.

Release Info

Release Info lists Core and Frontend separately. Each shows its build date and, when provided by the build, a release tag or commit and branch. Missing build information is shown as Unavailable. Use these details when checking which versions are running or reporting a problem.

System Health

System Health reports Healthy or Degraded, with individual up, down, or n/a badges for:

  • Database: database availability.
  • Pre-seeded: initialization data readiness.
  • Redis: queue broker availability.
  • Workers: worker availability.

For example, Redis can be up while Workers are down: jobs may be accepted but remain unprocessed until workers are available. Follow the health-check guidance to investigate a degraded state.

Task Status

Task Status shows success, warning, and failure counts, plus a total and success-rate bar. Counts use the latest persisted outcome for each worker identity, so repeated runs of the same source or bot do not continually increase the totals.

Warnings contribute to the total but are separate from successes and failures. The success rate counts only full successes. Use Execution History for recorded outcomes and Queue Failures for jobs currently held as failed in the queue system.